How to Make a Pie Chart in Excel: Step-by-Step Guide for Beginners (2024 Update)
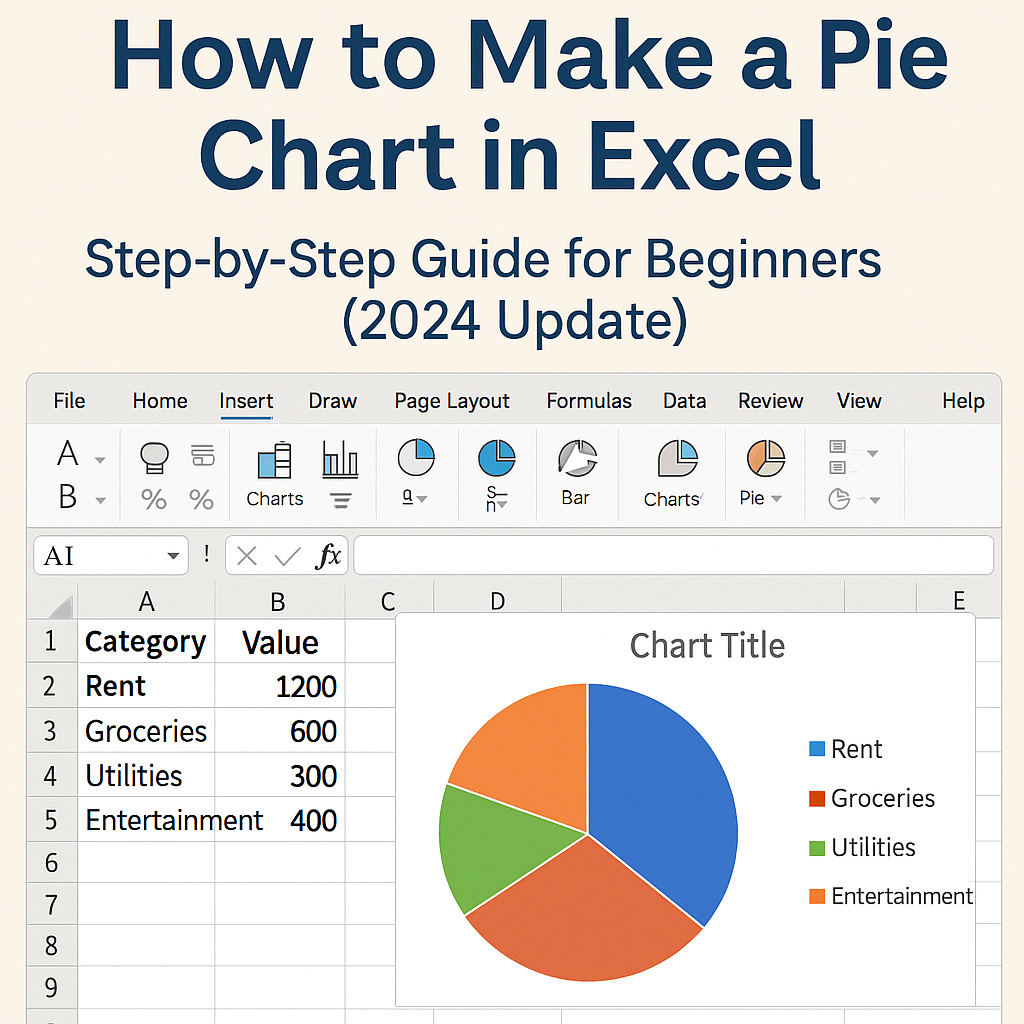
Introduction to Pie Charts in Excel What is a Pie Chart? A pie chart is a circular graph that displays data in slices, each representing a proportion of the whole. It’s an ideal visual tool for showing percentage-based data, making it easy to understand at a glance. Why Use Pie Charts? Pie charts are best … Read more